

One of the joys of parenting is the opportunity to create traditions. In fact, children represent such an unrepentant annihilation of time as a concept that I might say you need traditions. In our household,1 one that seems to have organically sprung up and will be sticking around is Pancake Day.2 It is observed every Saturday morning with fresh pancakes, and each observant can choose between plain and chocolate chip.
As always, huge thanks to manim.
So, I have spent almost every Saturday morning the last few months squinting and under-caffeinated, sprinkling mini chocolate chips onto pale disks of gluten-free vegan3 batter. Every time, my mind wanders into the mathematics of uniformity and dispersion. “Was this spread of chocolate chips better than the last? How would I measure it? Is there an objectively best place to put the next chip?” And every time, that rabbit trail is buried under a deluge of coffee, maple syrup, nap times, snack times, parks, diapers, games, crafts, laundry, and general errands. Until now!4
Ingredients
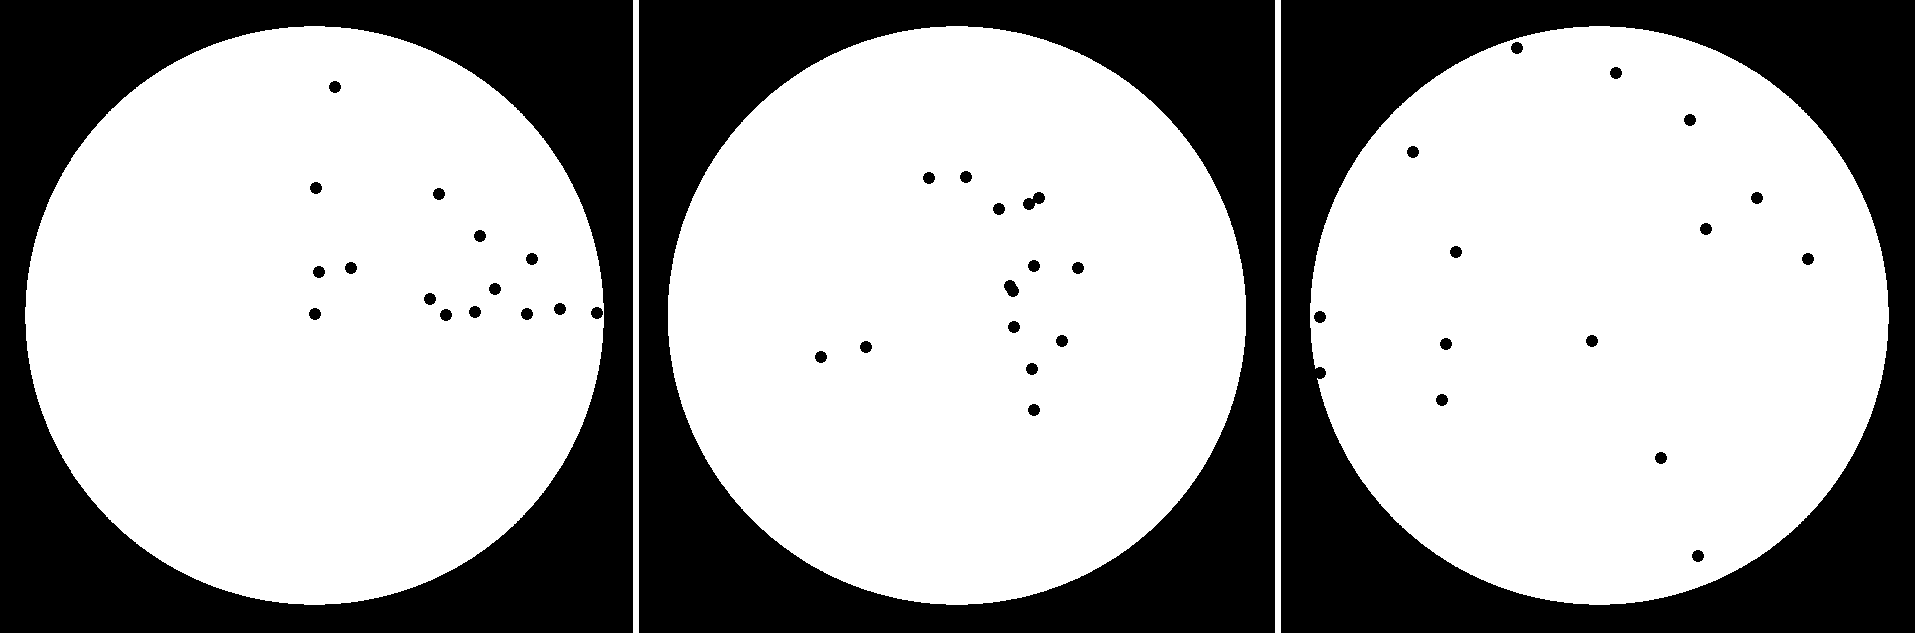
Let’s set the table, so to speak. Our building blocks are one pancake batter disk5 and a set of mini6 chocolate chip points that lie within it. For simplicity, I’ll treat chocolate chips as true points, that is, objects without area that cannot overlap.
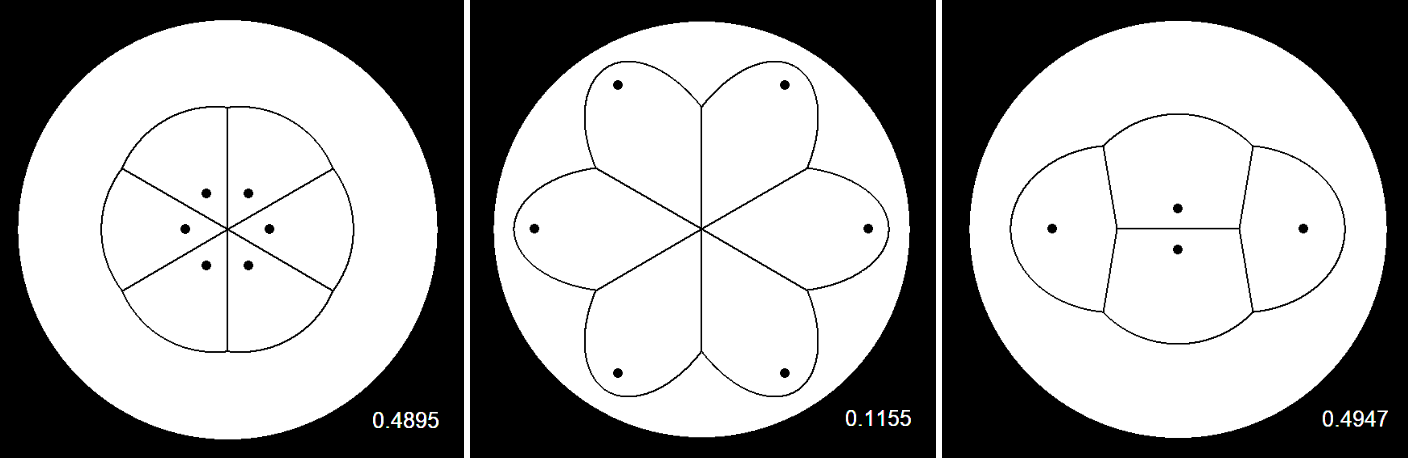
That’s essentially the end of our two-part list of geometric ingredients. The hope is to construct some kind of measure that is able to distinguish different pancakes. Ideally, it would rank this triplet worst to best from left to right.
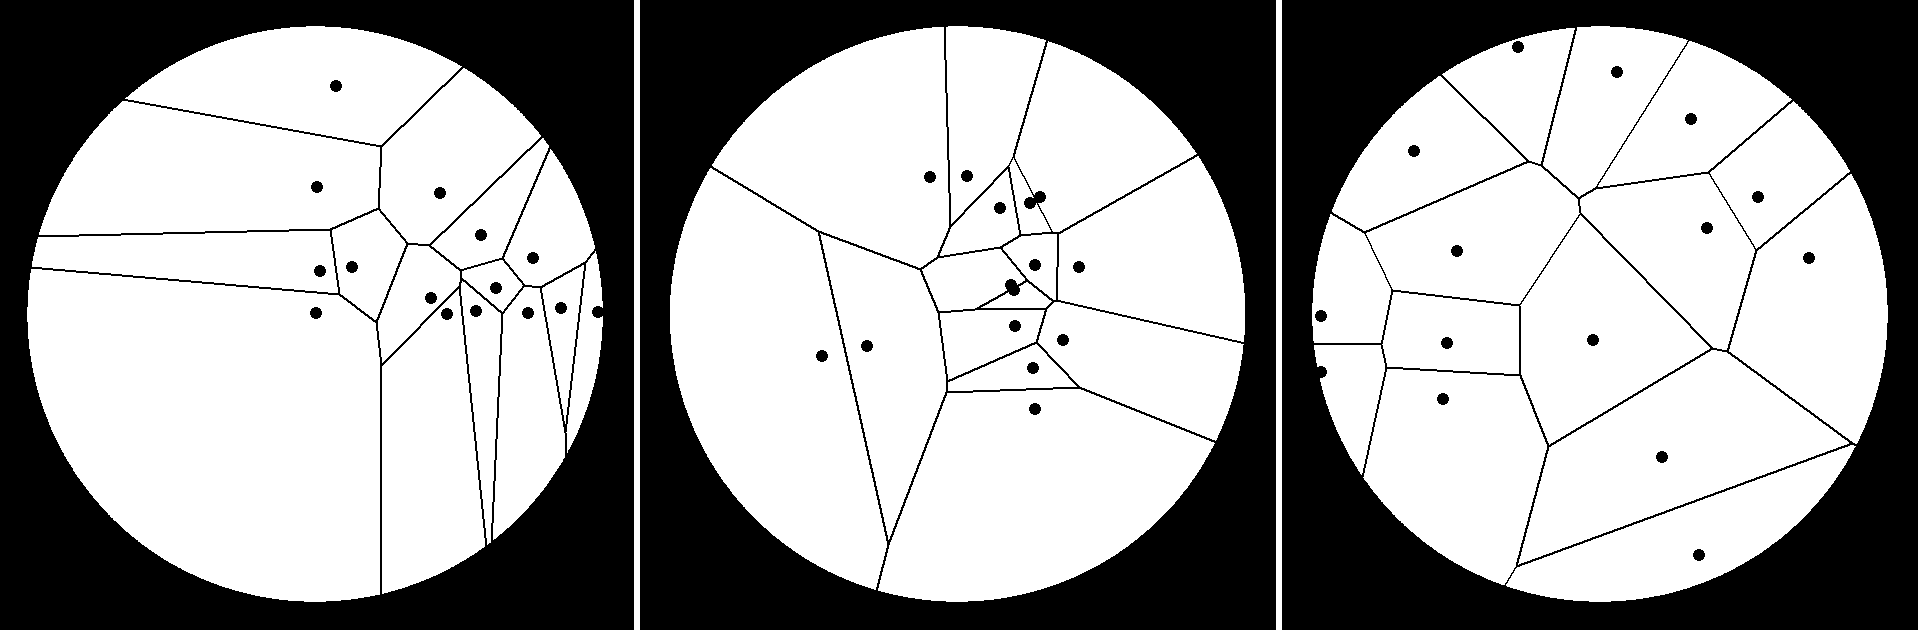
To accomplish this, I’m going to make use of a tool I find deeply gratifying in its clarity and simplicity: the Voronoi diagram. It splits an area into partitions according to the points in said area. The space surrounding each point is the region that is closest to that point. Each line in a Voronoi diagram represents a halfway boundary between two points.
Preparation
You might be able to see where I’m taking this based on the previous example. Notice that in the “best” version, the areas of each region are pretty similar, in contrast to those in the others which contain a broad range. In fact, let’s plot those out in a handy histogram7:
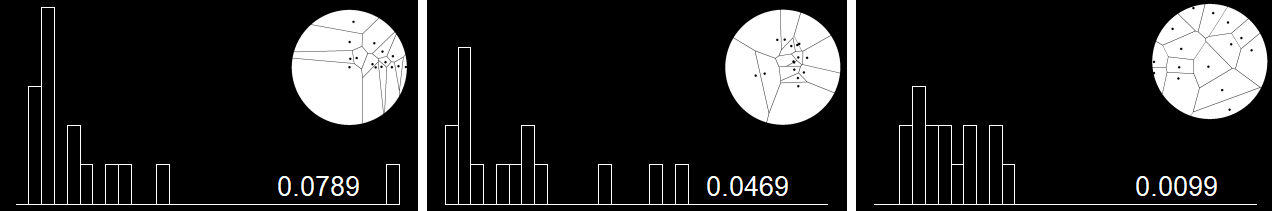
It seems like the distribution of areas of a “good” pancake is tighter and more uniform than that of a “poor” pancake. In statistician’s terms, then, the metric we’re looking for is the variance of the areas of the Voronoi diagram, with smaller variance being “better” (all else being held equal). This seems like a solid starting point, and the next step as always is to break it.
Cooking
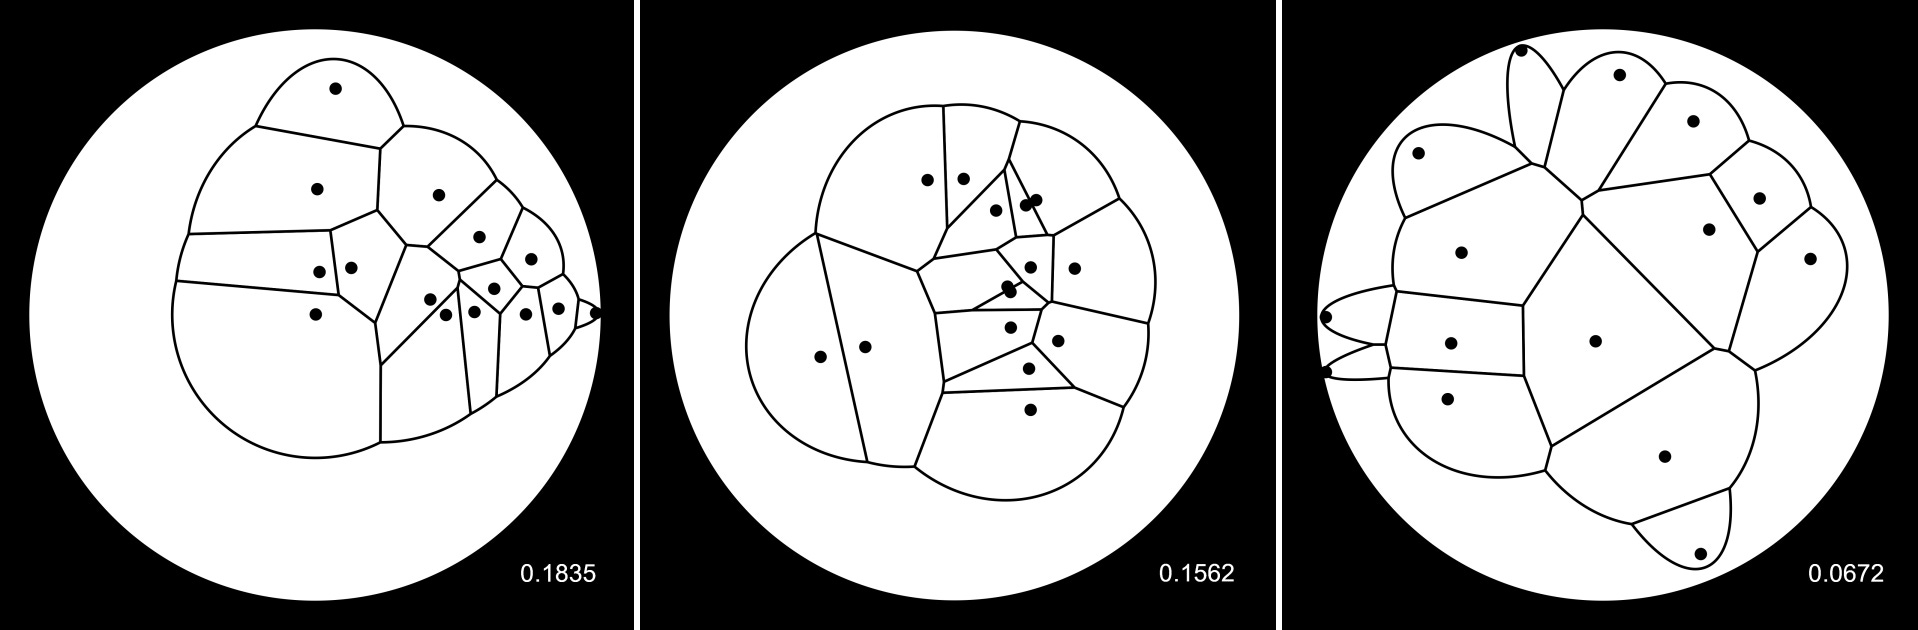
Here are some examples of low-variance pancakes that don’t pass the sniff test.8
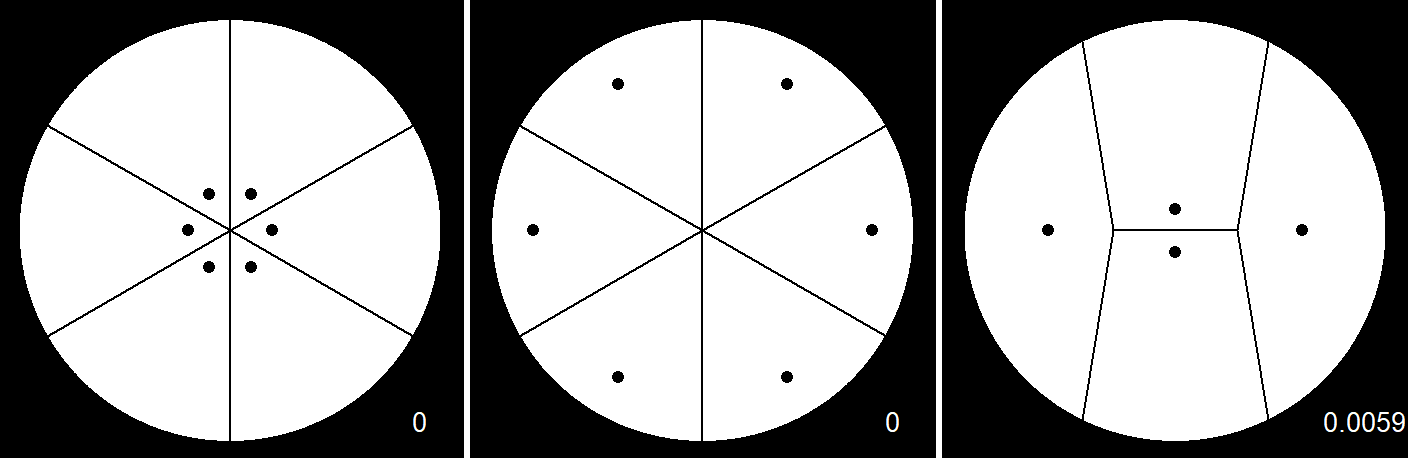
What’s missing here? I’d argue that the big information gap between the metric and (my) intuition is the edge of the pancake. Let’s tackle this wrinkle and see how much more robust the measure becomes. I’m going to augment the Voronoi with a sort of pseudo-Voronoi concept: a halfway boundary with the edge of the disk.9 Now, every region will belong either to a chip region or the singular edge region, depending on what is closest, and we can include this special new region the area variance calculations.
Plating
With this edge-aware Voronoi variance metric, we now have some guidance for the “next” chocolate chip. It should be placed where the edge-aware variance is most decreased.10 Finding that point on a general mathematical pancake is not trivial, but if all else fails, just sample randomly. Let’s return to our first three examples, this time with edge-awareness.
Each of these has some sizable gaps, but we can find the best choices (according to area variance) for each one and see how it aligns with intuition. This will be different than approaching with some sort of area-greedy algorithm, or any number of other choices I’ll get into later. Here are the next three chocolate chips for each of our example pancakes.
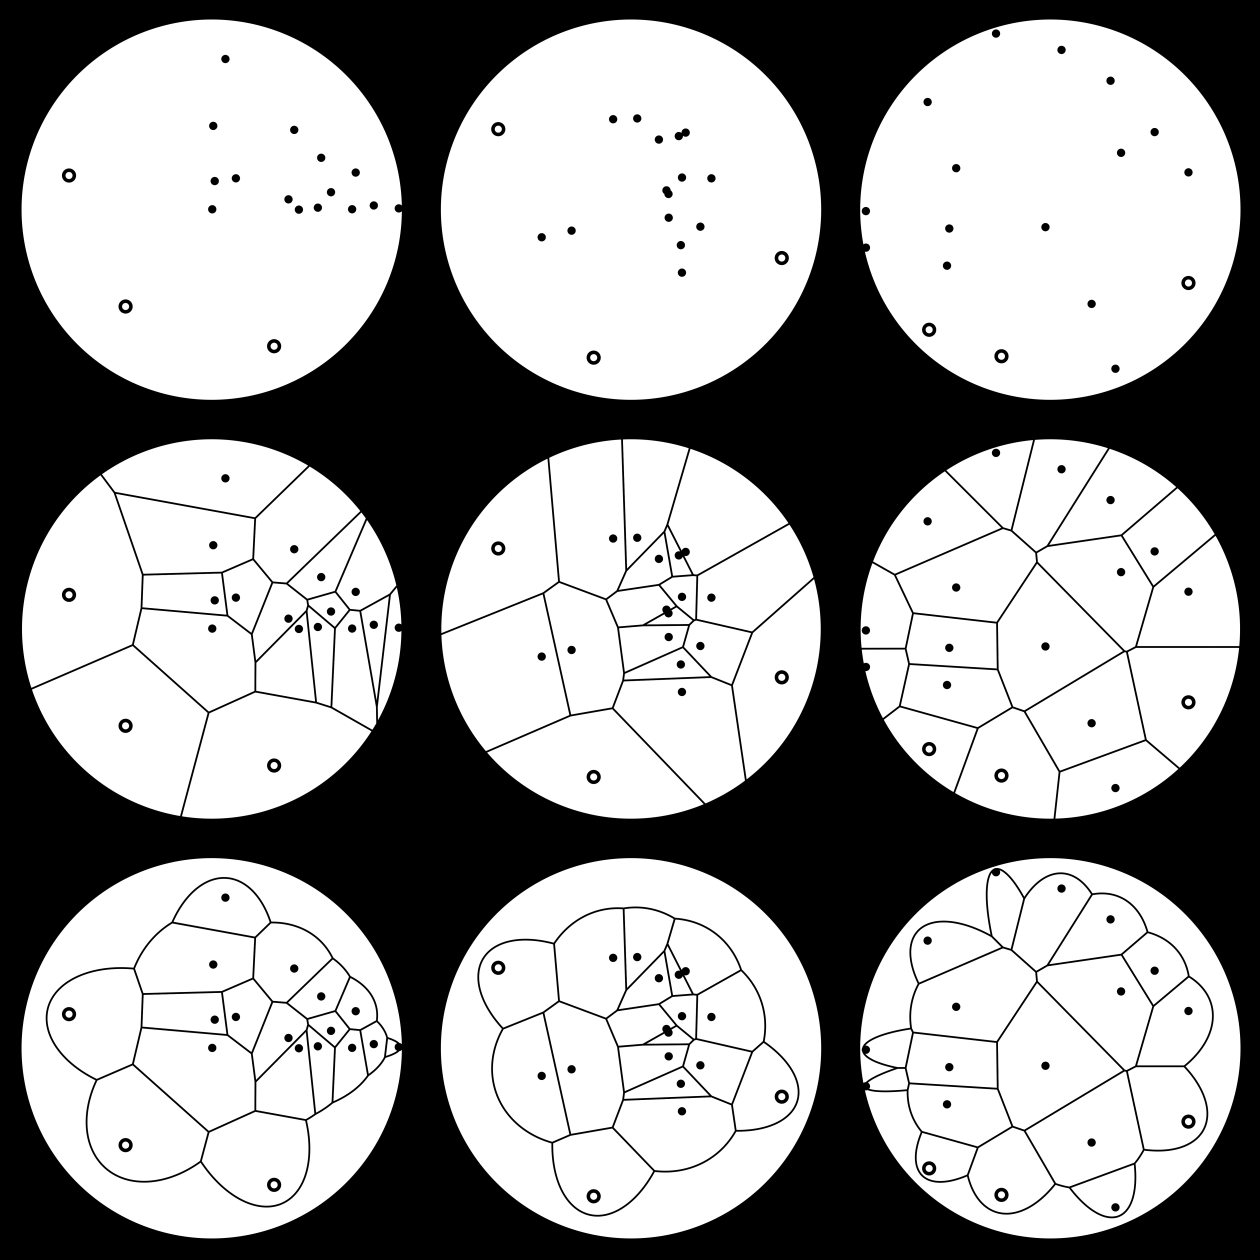
Pretty in line with expectation I’d say! All of the dispersions are improved by these additions, and any remaining gaps are much smaller. When I try to choose these points without edge-awareness the extreme borders are heavily favored, so this might be a good (albeit complicated) middle ground to match the qualitative “gut” placement. On to the roads not taken:
Dirty Dishes
There is a whole host of other ways to overanalyze points on a plane. The big one I wanted to get to before this ballooned by itself was Delaunay triangulation, which is a sort of inverse Voronoi. There's probably some rich soil there to feed this idea further.
I’m also curious how judging the shapes individual Voronoi cells different ways might change the next chocolate chip, akin to how we quantify the natural-ness of electoral shapes. Rounder cells mean more uniformity, and new placements would favor erasing sharp corners.
Last, and most theoretically intense, would just be overlaying the pancake with a kernel density estimator and picking the deepest valley. This feels very low on the arbitrary scale, but you still have to make some decisions about the edge that are more aesthetic than academic.
Thanks for making it this far. Have some pancakes this Saturday.
At the time of this writing — which could be months from the time of publishing if I’m honest — we have a baby with about 90 minute wake windows and an almost kindergartner but I think time and its rhythms are least kind to the 2.5 year old right now. She can feel the difference between a weekday and a weekend, but (unlike the older sibling) doesn’t really know what kind of day is about to happen until she wakes up. Being this age is like living through Memento with fewer clues and no driving mission.
You’re never going to guess what we do on Pancake Day.
Will my children ever forgive me?
I’m just going to be talking about one way you could put numbers to this concept. It’s by no means the only way, much less the right way.
Except during the holiday season when pancakes become snowman shaped, or Valentine’s Day when they become heart-shaped (and pink).
The “mini” is key here, for both mathematical and culinary reasons.
Point of clarification: I’m just sticking to the unit circle, so for this whole piece the Voronoi areas will all add up to π.
Taste test? Squint test?
I should state explicitly that the halfway boundary between a circle and a point within it is an ellipse. The foci are the point itself and the center of the circle, and the semi-major axis is half of the radius of the circle. This wasn’t obvious to me and took a lot more work that it should have, but that says more about me than it does the problem.
Or, said another way, increased the least.