
Net On-Court Win Probability
Because sports doesn't have enough statistical measures yet


It is difficult to overstate the impact that every single one of the ten players on a basketball court can have on the outcome of a game.1 Basketball, probably more than other (team) sports, carries with it a narrative of singular, unstoppable talent. “The team with the best player wins” is a common refrain, whether in half-jest or genuine recognition of a dominant performer. I don’t find this angle particularly compelling, and you don’t need to watch the quarters out of order to see the impact that tiny adjustments and reactions-to-reactions have. It’s a game of inches that, yes, showcases unbelievable talent and athleticism, but also squeezes every drop of cerebral juice out of the margins of every domino chain of decisions.2
How do we even begin measuring this? The state of the art right now leaves really no stone left unturned. Analytics has answers for shot arc and spin, specific expected point outcomes for specific player combinations of pick and roll, where to take a three, and when to foul (even if you’re ahead by 63). Basketball is awash in metrics that are great for making the specific kind of comparison you want, but every choice brings a tradeoff.
Weapons of WAR
Yes I’m very proud of that pun.4 I’ll go through these “advanced” stats kind of rapid fire since a deep dive could be its own post.
Box Plus-Minus (BPM): A team’s net point difference when a specific player (or group of players) is in. This can come in a lot of different flavors (APM, RPM,…) depending on what other things you want to account for, but BPM is the most common and defensible.
Player Efficiency Rating (PER): An absolute patchwork of weights, linear combinations, and straight up opinions that mostly just rewards offense and then gets centered around 15 to make it roughly consistent season-over-season.
Value Over Replacement Player (VORP) or Wins Above Replacement (WAR): Definitely not my most hated measure, as it is pace adjusted, but still just a lot of constants picked and arithmetic-ed together.
Win Shares (WS): Another Frankenstein of opinions.
When I look at this list, I see a lot of arbitrary choices, a lot of metrics that do not respect context (A buzzer beater needs to matter more than a garbage-time dunk), and a lot of ambivalence about the fundamental outcome of the game.5
Win Condition
In Moneyball6, the statistical chorus we hear over and over is “he gets on base“. It’s the stat that cuts to the bone of the foundational goal of baseball offense: don’t get out. Basketball has its own foundational goal, but it doesn’t benefit7 from the discrete atomization of baseball. You still win by outscoring the opponent, but the quantum of performance is much less clear.8
The context that I mentioned evades Box Plus-Minus is central to my pitch for this new direct measure of outcome. It is agnostic about how much a player imposes themselves on the box score, or on usage, or any other traditional measure for that matter. It is simply an accounting of how win probability changed over the course of the game and who was on the court when those shifts took place. I’m calling it Net On-Court Win Probability.9 This might be easiest to explain with the rather goofy hypothetical of a 10 minute 1v1 game that for some reason features substitutions. I’ll just focus on one team and one substitution.
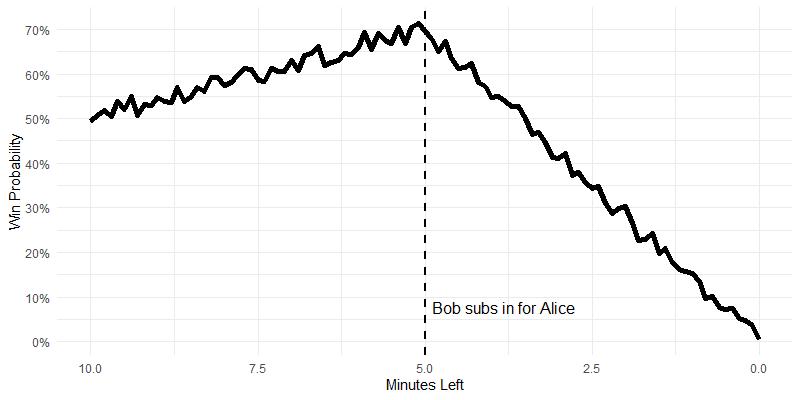
Alice starts the game and gets subbed out halfway though, after accumulating about 20% (or 0.2) worth of NOCWP. Her teammate Bob chokes the game away and is responsible for -0.7 worth of NOCWP in the end. In this situation (where a game begins at 50% WP), the losing team will accumulate -0.5 of NOCWP in total, and the winning team will gain 0.5 across all players. Notice that losing players can still accumulate positive NOCWP (and vice versa).
As long as we are careful about who is on the court when, and what the win probabilities are at each stage, we can do some pretty straightforward arithmetic to sum up each player’s NOCWP. This is a much simpler exercise in mathematics than it is in data sourcing and programming because of the NBA’s very un-baseball-like10 relationship with publicizing data. I’ll forge ahead and dump some caveats in a footnote.11
Meta Shifts
I we make a win probability model every year, a useful knock-on that we get for free is a sense of how the NBA as a whole has shifted over the years. We can watch the 3-point revolution usher in an era of no-lead-is-safe parity, and quantify the value of having home court advantage.
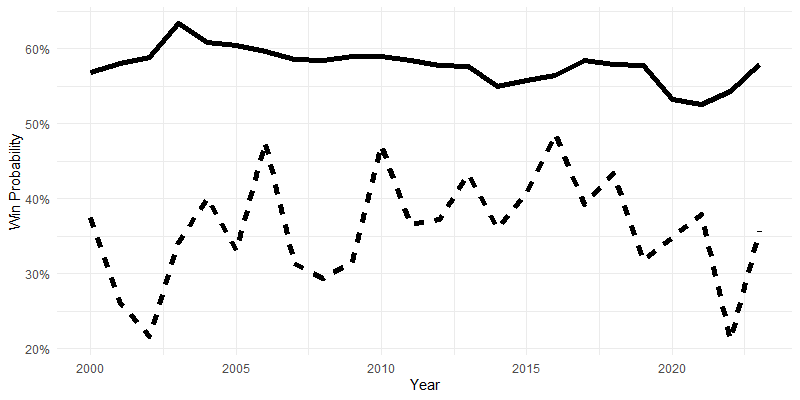
Home court advantage bottoms out during the pandemic, a small validation to our approach. The buzzer-beater scenario is a bit noisier, though, peaking around 2016 as offense and pace is prioritized by the league.
Leaderboards
What does this new measure tell us when we apply it to player rotations? What is it trying to do? I’d argue it does (or tries to do) two things very well:
Makes use of on/off timing to get a nuanced sense of when a player is actually making an impact. This is like BPM, but BPM is still context-agnostic as it doesn’t differentiate between a garbage-time dunk and a game winning buzzer-beater.
Implicitly bakes in context by swapping point difference for win percentage. Point difference is how we decide who wins12, but all margins are created equal. Winning by 30 is the same as winning by 113, and you’d rather maximize your probability of winning than maximize your lead. Very correlated, but not identical.
NOCWP does not care if you scored 15 points against the other team’s bench in a blowout, or missed a three-quarter-court heave at halftime. It cares about how the outcome of the game shifted while you were on the court. Clutch plays have the potential to shift win probability from under 5% to over 95% in seconds, and NOCWP cares about this. It also cares about that solid second string that holds a lead while the starters rest.14
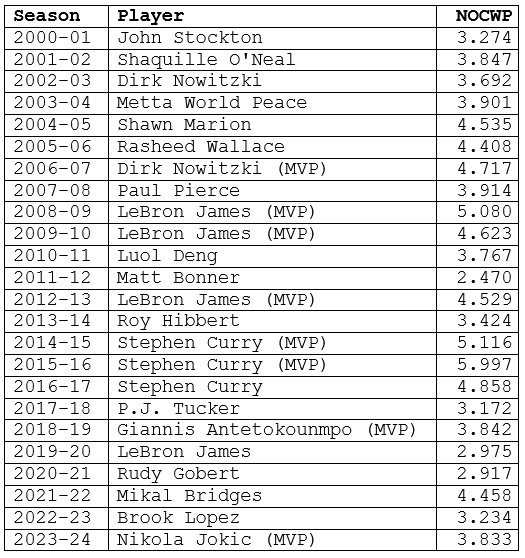
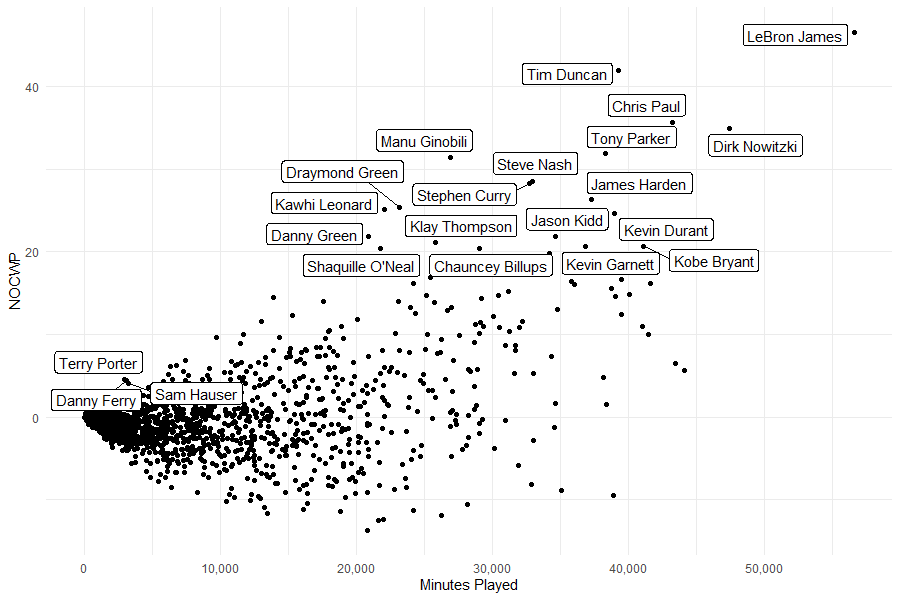
As one might anticipate, NOCWP is not kind to losing teams, especially starters on those teams. I personally like this. I care more about whether a winning team thinks you should be on the floor than if you drop a 30-point triple-double in a loss.15 One downside is that the starters on a good team tend to lump together, which is admittedly a design choice that points back to the intractability of each player’s true impact.16 Here are the last two decades of the NBA NOCWP leaders. There are some truly hilarious names that bubble up here so brace yourselves.
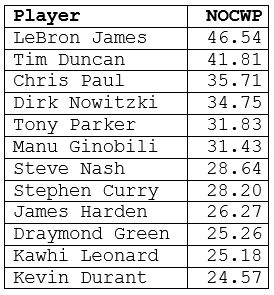
And for completeness, here are the top dozen aggregate NOCWPs since 2000-01:
Future Tweaks
There are a lot of ways to augment what I did here, some if which I already alluded to. Adjusting by minutes gets to the very punchy NOCWPPM, which is extremely noisy unless there are some strict sample size minimums.17 I could also (instead of divvying net WP up into fifths) do some weighted scheme by say usage, but there’s no real "defensive usage” readily available, and I’m hesitant to skew the whole measure towards offense. The biggest easy improvement whenever I revisit will probably be incorporating team elo or some other measure of form so my predicted win percentages are more nuanced/accurate.
Here’s to hoping that when I return to this problem space the NBA will be nicer about its data, or at least publish some play-by-play from before 1999.
You can begin dissecting the other team with a single look, or your movement off the ball, or fake instruction for a teammate. The list of things not reflected in the box score really has no end. Like its musical parallel jazz, sometimes it’s all about the shots you don’t take.
This is at its best in playoff defensive rotations. It’s extremely hard to fully appreciate this artistry live because of how fast and in-sync a group has to be acting to be effective (and how little has to go wrong for it all to collapse).
This is a failure of incentives, of the rules themselves. But that is an entirely separate (and much angrier) digression.
Especially because of how often they all get used as cudgels by the sports pundit economy.
A perennial debate in the NBA discourse is how much (if at all) to credit the big fish in a little pond. How valuable is the superstar who scores 30+ per game on a team that won’t even make the playoffs?
You should be impressed I made it this far before a mention, honestly.
or suffer
Or more precisely maybe, less quantizable. A baseball game is defined by its terminal state - 27 outs. This is much more discrete than 48 minutes, although that may also be divisible into indivisible pieces.
NOCWP? NOWP? NOCWiP? Brevity is indeed the source of wit.
Pretty early on in the baseball/math marriage, the MLB correctly identified advanced analytics as a source of new fandom and engagement. They made it easy, and haven’t looked back. The NBA data landscape, on the other hand, is an open source patchwork of reverse-engineered APIs that essentially scrape the league website.
The earliest season I’m able to procure any play-by-play data is 1999-2000. The NBA also blacks out the final five minutes of every game’s win probability. Not a huge deal to build our own, but still frustrating when this could be built off a canonical source. I’ll be running a simple decision tree on the previous season’s second-by-second records to build each annual model. So every win probability I estimate in the (for example) 2014-2015 season is based on observations only from the 2013-2014 play-by-play game records. I’m not adding any skill or form-based information in, so the model is agnostic towards which teams and players are actually playing. Regular Season only.
Hire me, ESPN.
Or, as the saying goes, two points is two points.
A situation where the box plus-minus is flat even though win probability increases.
hypothetically
Who’s to say whether PJ Tucker is worse than James Harden?
I vote you abbreviate to NOWP because it's more fun to disagree with 😁 The masses thrive on dissension!